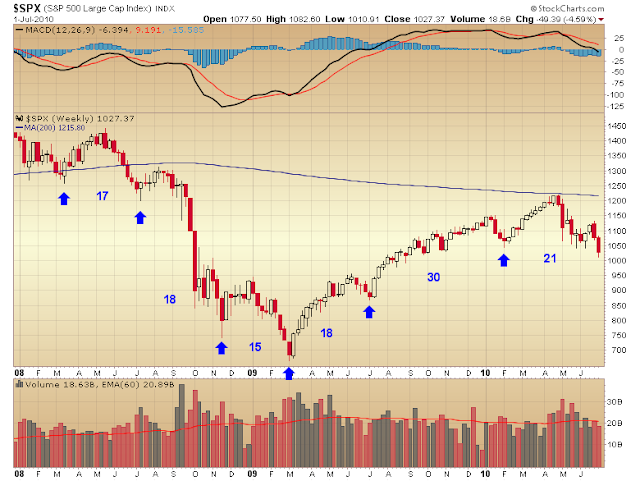
First off way too many people are counting on the head and shoulders pattern taking the market directly down to 850. Folks historically these head and shoulder patterns have a success rate of about 50%. A coin toss. Didn't we learn that lesson last July?
Anyway on to the charts.
My friend Doc noticed that the market dropped down to the 75 week moving average yesterday and bounced strongly. You can see that during the prior bull the 75 week moving average acted as final support during the entire bull market. That level also happens to be the 38.2% Fibonacci retracement of the entire cyclical bull move. Not an unusual correction in an ongoing bull on both counts.
Next we are now right in the timing band for a major intermediate cycle low.
At 21 weeks it's just way too late to press the short side. You risk getting caught as the intermediate cycle bottoms initiating a violent short covering rally.
Next, breadth is diverging massively during this final move down. As you can see the NYMO often diverges at these intermediate cycle bottoms. The divergence at this point is the largest in years.
And least of all we now have a momentum divergence forming on the daily charts.
Finally I'll point out that the February cycle bottomed on a reversal off the jobs report. I think it's safe to say the market has already discounted a bad number so we could see shorts begin covering in a buy the news type trade, even if the number is bad. And if it's good we will see the market gap higher huge, trapping shorts and throwing gasoline on the fire of a short covering rally.
It's just too dangerous to continue pressing the short side at this point. Better to just step aside and not risk getting caught in the intermediate bottom that WILL happen sometime soon, maybe even on today's employment report.


Hiç yorum yok:
Yorum Gönder